We look for the last selected column on average, \langle c_\text{last} \rangle explored by the Proximity Table based k nearest neighbours algorithm. We look at the central point of a Gaussian distribution of nodes centred at the origin, and assume that the statistics allow us to consider it as a general case.
The probability to find a node at a distance r from the origin is given by a half-Gaussian
p(r) = \frac{\sqrt{2}}{\sigma\sqrt{\pi}} \exp\left( -\frac{r^2}{2\sigma^2} \right)The number of cells in a radius r is c(r)=ar (easily verified with a square grid). Hence the number of nodes (or objects) at radius r is given by
o(r) = \mathcal{N}c(r)p(r)with \mathcal{N} a renormalisation factor to ensure that N be found in [0,\infty) and therefore verifies
\int_0^\infty \mathcal{N}c(r)p(r) = Nwhich in turn gives
\mathcal{N} = \frac{N\sqrt{\pi}}{a\sqrt{2}\sigma} \quad \Rightarrow \quad o(r) = \frac{N}{\sigma^2}r\exp\left( -\frac{r^2}{2\sigma^2} \right)We look for the radius \tilde{r} such that k neighbours have been found. That is, we solve for \tilde{r}
\int_0^{\tilde{r}} \frac{N}{\sigma^2}r\exp\left( -\frac{r^2}{2\sigma^2} \right) dr = kGiving \tilde{r}^2 = 2\sigma^2 \ln\left(\frac{N}{N-k}\right). Finally, we count the number of cells that were explored before reaching radius \tilde{r}, i.e. \langle c_\text{last}\rangle
\langle c_\text{last} \rangle =\int_0^{\tilde{r}} ardr = a\sigma^2\ln\left(\frac{N}{N-k}\right)Note however that for large N , this tends to zero, when we know that \langle c_\text{last} \rangle \geq k. This is because the previous integral was taken from r = 0 when in truth there exists a minimal radius r_\text{min} before one may find neighbours. To correct for this, we write
\langle c_\text{last} \rangle = a\sigma^2\ln\left(\frac{N}{N-k}\right) + kOne last remark that must be made is that because we have a half-Gaussian PDF, the parameter \sigma is not the standard deviation of the distances, which is related to the true SD s as
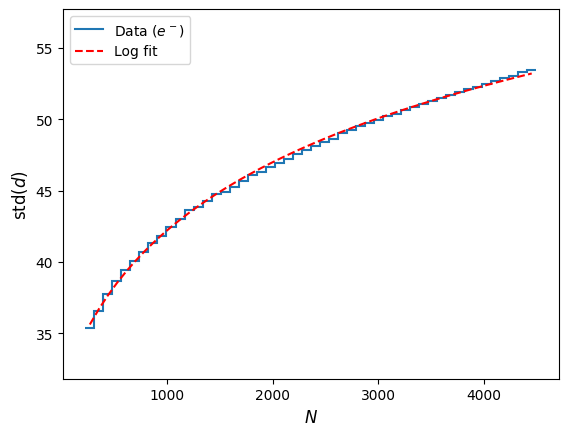
\sigma = s\sqrt{\frac{\pi}{\pi-2}}Fitting the standard deviation on the data with a logarithm (the number of available cells as we increase the radius increases exponentially, see Figure 1), we find that the average last selected column should be
\langle c_\text{last}\rangle = A\ln^2(N)\ln\left( \frac{N}{N-k} \right) + kmeaning that at first order \langle c_\text{last}\rangle = \mathcal{O}\left(\frac{\log^2(N)}{N}\right), and therefore that the complexity of the PT-KNN algorithm is \mathcal{O}\left( \log^2(N) \right).